What is FloodLight, exactly? Mahwish Khan, Director of Communications at Code for Pakistan CfP answers my question –:
“FloodLight is a crowdsourcing initiative where we’re plotting out information related to flood activity on a map so that those who need help can easily find it, and those who want to help can connect with others and come together as a community. Although the CfP team started this initiative in the middle of the night, using a platform called Ushahidi, this has been largely a community effort in itself. We set up the framework and then, as news started coming in about shelters, charity organizations, and aid, we started plugging all that information in. At some point during the day, we saw that Shafeeq Gigyani and his team had developed FloodPK.com, which was such a great resource. We teamed up with him to integrate our map with his website, and now, other people from the tech ecosystem are building on top of FloodPK.com, so it is really a go-to resource for all flood-related data.”
The team is updating FloodLight as more data comes in, gathering scattered information in one place, with several volunteers working at all hours to make the data accessible to everyone. The objective is to gather data on the flood situation in Balochistan, Sindh, KPK, and Punjab, regarding a number of different aspects; as of now, you can find information regarding shelter locations, types of relief needed, locations of flooded areas, relief collection points, latest news on the flood, fundraisers and government data on the water flow. More options are yet to come, like a vendor list giving charities an easier way to compare prices for in-demand items such as tents.
The collected information is presented on Ushahidi, which is an open-source solution that was originally intended for electoral mapping but has since grown to be a tool to give communities a voice. In this particular instance, it is helping multiple groups navigate through this humanitarian crisis, trying to provide better data from rural and lesser-known territories of Sindh and Balochistan, and exhibiting it all more effectively via the map.
The team looks forward to joining hands with anyone who wants to partner, as authentic information from volunteers on the ground can truly advance the data mapping process.
“I am collecting data from Swabi and I am in touch with volunteers at Al-Khidmat Foundation. We need more sources to make this data more accurate. As of now, we don’t know if the government will use this data or not, but it can certainly help them. We are collecting this data so anyone can use it. For example, a lot of people don’t know where to donate so we are collecting the donation information. We are also mapping relief collection points and shelters so people can easily find them, and we are vetting all the entries to ensure that the data we have collected is authentic” explains Mubassir Hayat, who is leading this project on behalf of CfP.
Getting acquainted with Flood Light is crucial because there are numerous relief efforts happening simultaneously; there are those who are looking for answers and help, and there are others who desperately need it. FloodLight aims to serve as that connector, primarily giving hope to the affected. An ardent public response here can strengthen this platform, in turn mitigating the challenges and obstacles impeding the flood relief efforts in the country.
To help others find shelter or aid, it is imperative for those who have knowledge of these activities to plot them on the map; but again, the initiative is also for those looking to help; for example, an activist who is desperate for medical practitioners to see flood affectees in rural Balochistan can initiate a call for help and aid by adding their need to the map. Others can respond to the call if all the relevant contact information is provided. The point of the whole activity is to give power to the community, but the community needs to also let others know what exists and where. Here’s how you do it:
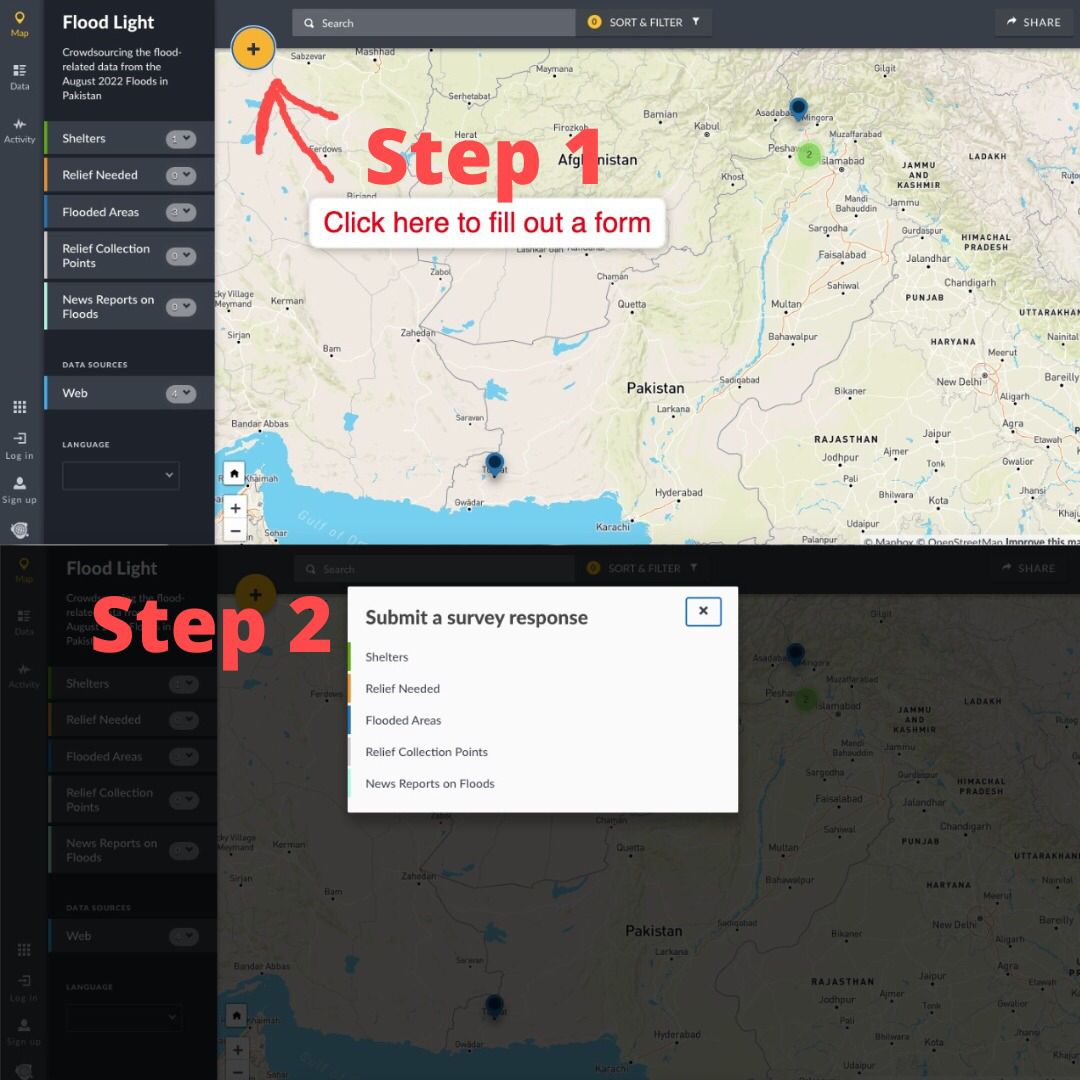
Go to FloodLight and start adding data in a two-step procedure. Once the page is open, any of the forms can be selected, and input the information around the activity. The forms are very simple and short so a data point can be added in less than 1 minute if all the details are there.
Step 1: Click on the yellow-orange circle with the + sign, this will open the ‘submit a survey response’ window.
Step 2: Select a survey response among the listed ones, this will direct to the information panel, whereby starred categories are essentially required, and the regional latitudes and longitudes can be tracked on Google maps and entered accurately. (Photo credits: Mahwish Khan, Director of Communications at CfP).
